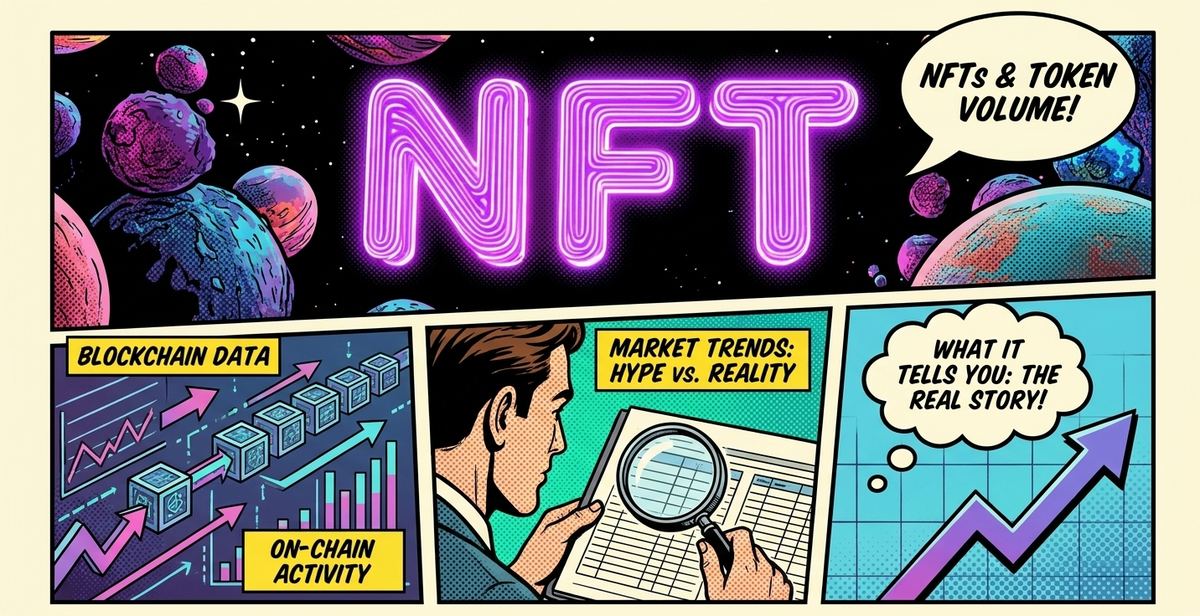
NFTs (non-fungible tokens) get discussed mostly in terms of individual sales and collections, but their connection to the broader market shows up more usefully in aggregate on-chain activity and its relationship to token volume.
What on-chain activity means
Every NFT mint, sale, or transfer is a transaction recorded directly on a blockchain network, and each of those transactions typically requires paying a fee in that network's native token. High NFT activity on a given network therefore tends to correlate with, and contribute to, that network's overall transaction volume — a connection that's easy to miss if you only look at token price in isolation.
Why this connects back to trading volume
A network seeing a surge in NFT minting or trading activity will often show a corresponding uptick in on-chain transaction counts and associated token demand, which can show up in the token's trading volume even without a direct speculative trade on the token itself. This is one more example of why volume figures can reflect ecosystem activity broader than pure price speculation.
Hype vs. sustained activity
NFT activity is notoriously prone to sharp, short-lived spikes tied to specific launches or trends, similar to the pump pattern covered in our crypto pump explainer. A single high-activity week doesn't necessarily indicate a lasting shift in a network's usage — sustained activity over a longer period is a more reliable signal than any single spike.
Where to actually observe this
Rather than following individual NFT collections, watching the underlying network's overall trading volume trend on its coin detail page over several weeks gives a more grounded read on whether on-chain activity — NFT-related or otherwise — is genuinely growing or just experiencing a short-term spike.